The Antler Copper Deposit is located 15km east of Yucca in northwestern Arizona, USA. It is a high-grade, polymetallic, volcanogenic massive-sulphide (VMS) Cu-Zn-Pb-Ag-Au deposit. Mineralisation outcrops at surface over 750m of strike. The Deposit dips to the west-northwest at around 55ᵒ.

Mineralisation was first discovered at the Antler Deposit in the late 1800s. Mineralisation was subsequently mapped to outcrop over more than 750m of strike. Intermittent mining occurred between 1916 and 1970 during which time approximately 70,000 tonnes of ore were mined at average grades of 2.9% Cu, 6.2% Zn, 1.1% Pb, 31.0g/t Ag and 0.3 g/t Au (~5.0% Cu equivalent).

In January 2020, New World entered into an option agreement to acquire 100% of the Antler Deposit. Following successful initial work programs, in October 2021, it exercised this option.

Prior to completing a PFS in July 2024, New World has drilled more than 150 holes for >60,000m, declared two JORC Mineral Resource Estimates and completed two Scoping Studies.

Antler Pre-Feasibility Study Summary

Location and Infrastructure

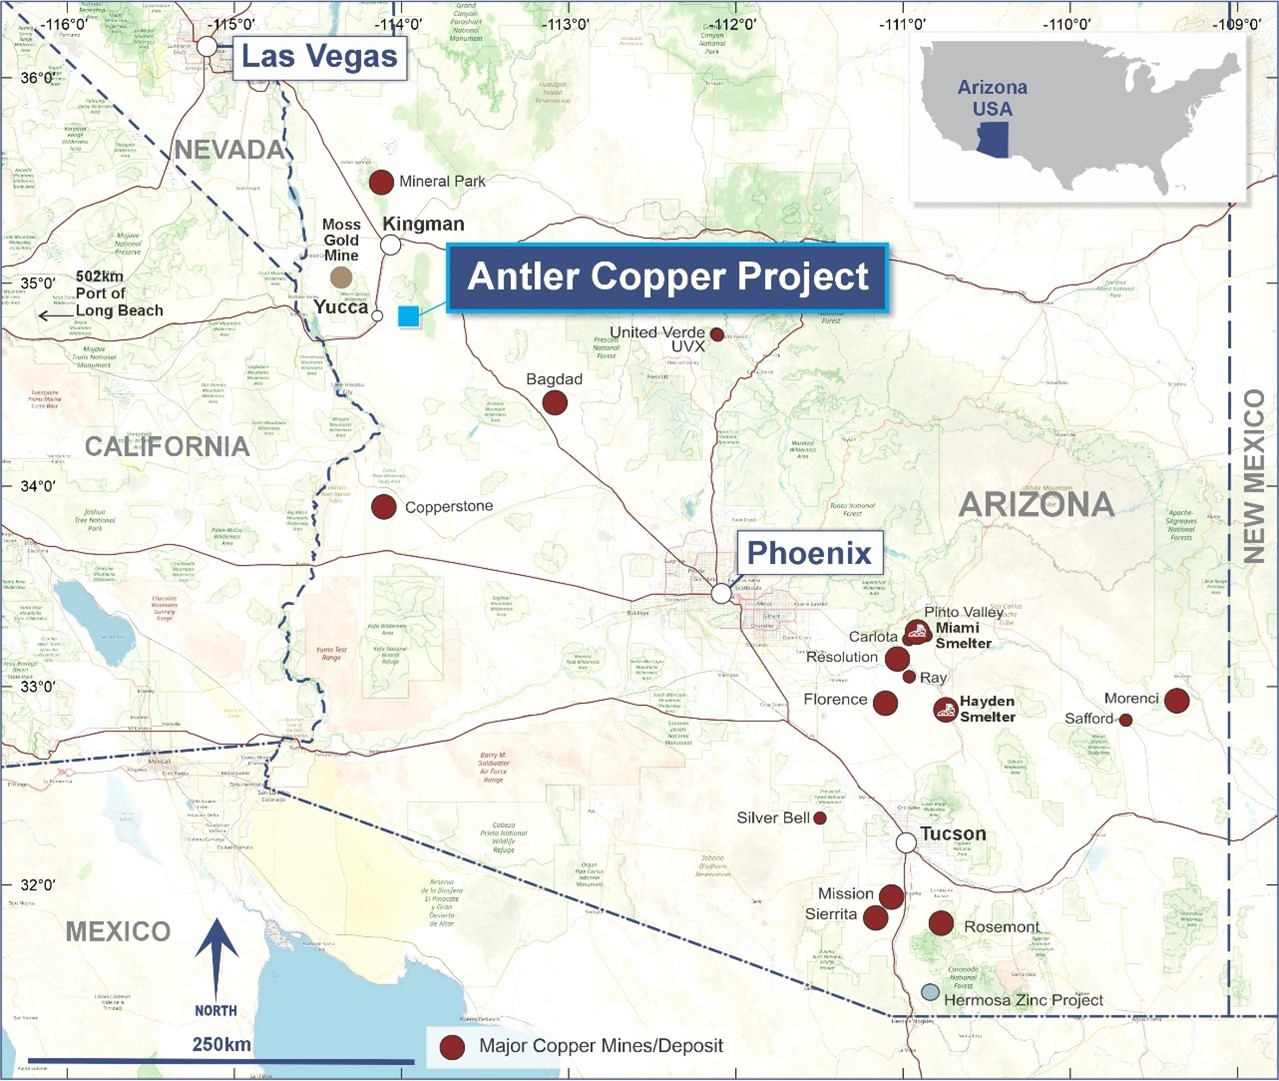
The Antler Project is located in a sparsely populated part of northern Arizona, approximately 200km south-east of Las Vegas and 350km north-west of Phoenix. New World currently bases its operations 40km to the north of the Project, in the city of Kingman, which has a population of approximately 35,000. The area is very well serviced with large scale infrastructure. There are multiple mining operations in the wider region (see Figure 1).

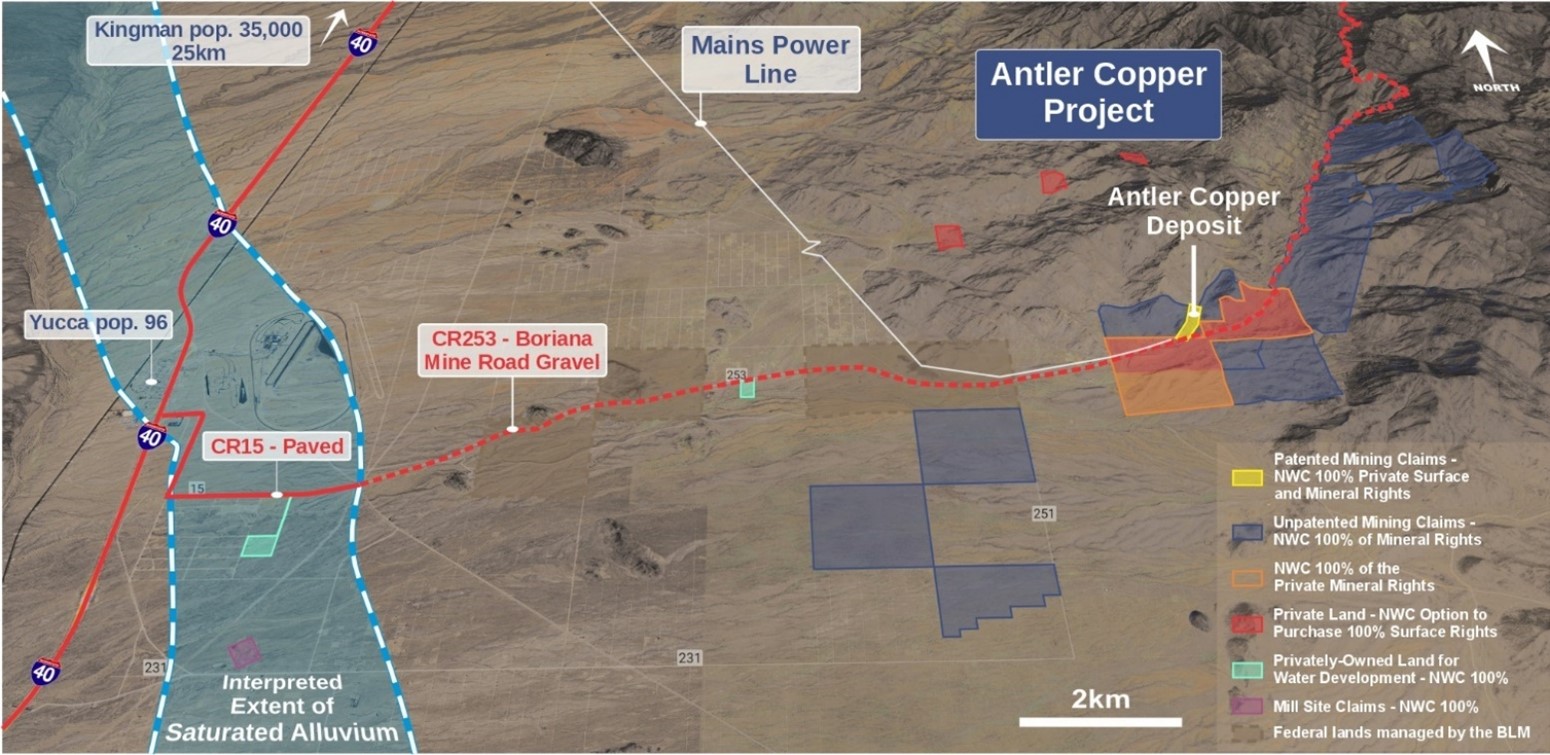
An interstate highway and transcontinental rail line can both be accessed 15km to the west of the Project in the town of Yucca. Unsealed roads extend directly from Yucca to the Project area. Mains power is currently transmitted to the planned site of the processing plant, albeit the transmission line will need to be upgraded for mining operations (see Figure 2).

Figure 1. Location of the Antler Copper Project, Arizona, USA.

Ownership

Mineral Rights

New World owns a 100% interest in:

  • Two patented mining claims (covering 40 acres), within which the Antler Deposit outcrops (private mineral rights);
  • 267 unpatented mining claims on adjoining Federal lands (covering 5,000 acres); and
  • 1,000 acres of private mineral rights immediately to the south, and to the east, of the Antler Deposit (see Figure 2).

Figure 2. Infrastructure and New World’s Mineral Rights and Land Ownership within the Antler Project Area.

Private Surface Rights

New World intends building the vast majority of the Project infrastructure on private land. This will help streamline the mine permit approval process.

New World currently owns, or has acquisition options over, 40 acres of patented (private) land within which the Antler Deposit outcrops, 838.9 acres of private surface rights in close proximity to the Antler Deposit and 40 acres of private land approximately 12km west of the Antler Deposit, where it intends to source 100% of the water required for its operations, together with an additional 19.6 acres of private land located 6km to the west of the Antler Deposit, where an intermediate water pumping station could be installed (see Figure 2).

Geology

The Antler Deposit is a high-grade, polymetallic, volcanogenic massive-sulphide (“VMS”) Cu-Zn-Pb-Ag-Au deposit. Mineralisation outcrops at surface over 750m of strike. The Deposit dips to the west-northwest at around 55ᵒ.

Mineralisation is laterally and vertically continuous over the 700m of strike that has been drill-tested to date, with mineralisation extending continuously from surface to down-dip depths >1,000m. Several thicker, steeply plunging shoots of high-grade mineralisation are evident. This thickening is interpreted to be due to structural repetition. primarily folding, while faulting may also locally control the thicker mineralisation.

Copper is the most valuable metal present, but significant revenue will also be derived from zinc, silver, gold and lead.

Mineral Resource Estimate

The JORC Mineral Resource Estimate (“MRE”) for the Antler Copper Deposit was updated in November 2022. This was used to underpin the PFS. The MRE comprises:

  • 11.4Mt @ 2.1% Cu, 5.0% Zn, 0.9% Pb, 32.9 g/t Ag and 0.36 g/t Au. (11.4Mt @ 4.1% Cu-equivalent1)

1 Resource Cu equiv. (%) = (Cu% x 0.872) + (Zn% x 0.889 x 3,011/7,507) + (Pb% x 0.591 x 2,116/7,507) + (Ag oz/t x 0.503 x 20.26/7,507x 100) + (Au oz/t x 0.700 x 1,709/7,507x 100). Refer ASX Announcement 28 November 2022.

Mining

To minimise the surface footprint and environmental impact of the Project, New World has committed to develop the Antler Deposit only with underground mining.

Mining Method

The primary mining method will be underground sub-level open stoping with paste backfill.

Pastefill will be generated in a facility located adjacent to the processing plant. Tailings from the processing plant will be mixed with a binder before being reticulated to the stoped areas as pastefill.

Access to the mine will be by way of a boxcut and portal that will be mined in the hillside at the southwestern end of the orebody.

A single, 5.5m(W) x 5.8m(H) decline (1 in 7) will be developed in the footwall of the deposit. Access drives from the decline, on 20m sublevel intervals, have been designed to crosscut the ore near the mid-point of the strike of the deposit. Subsequent ore development will measure 4.5m x 4.5m.

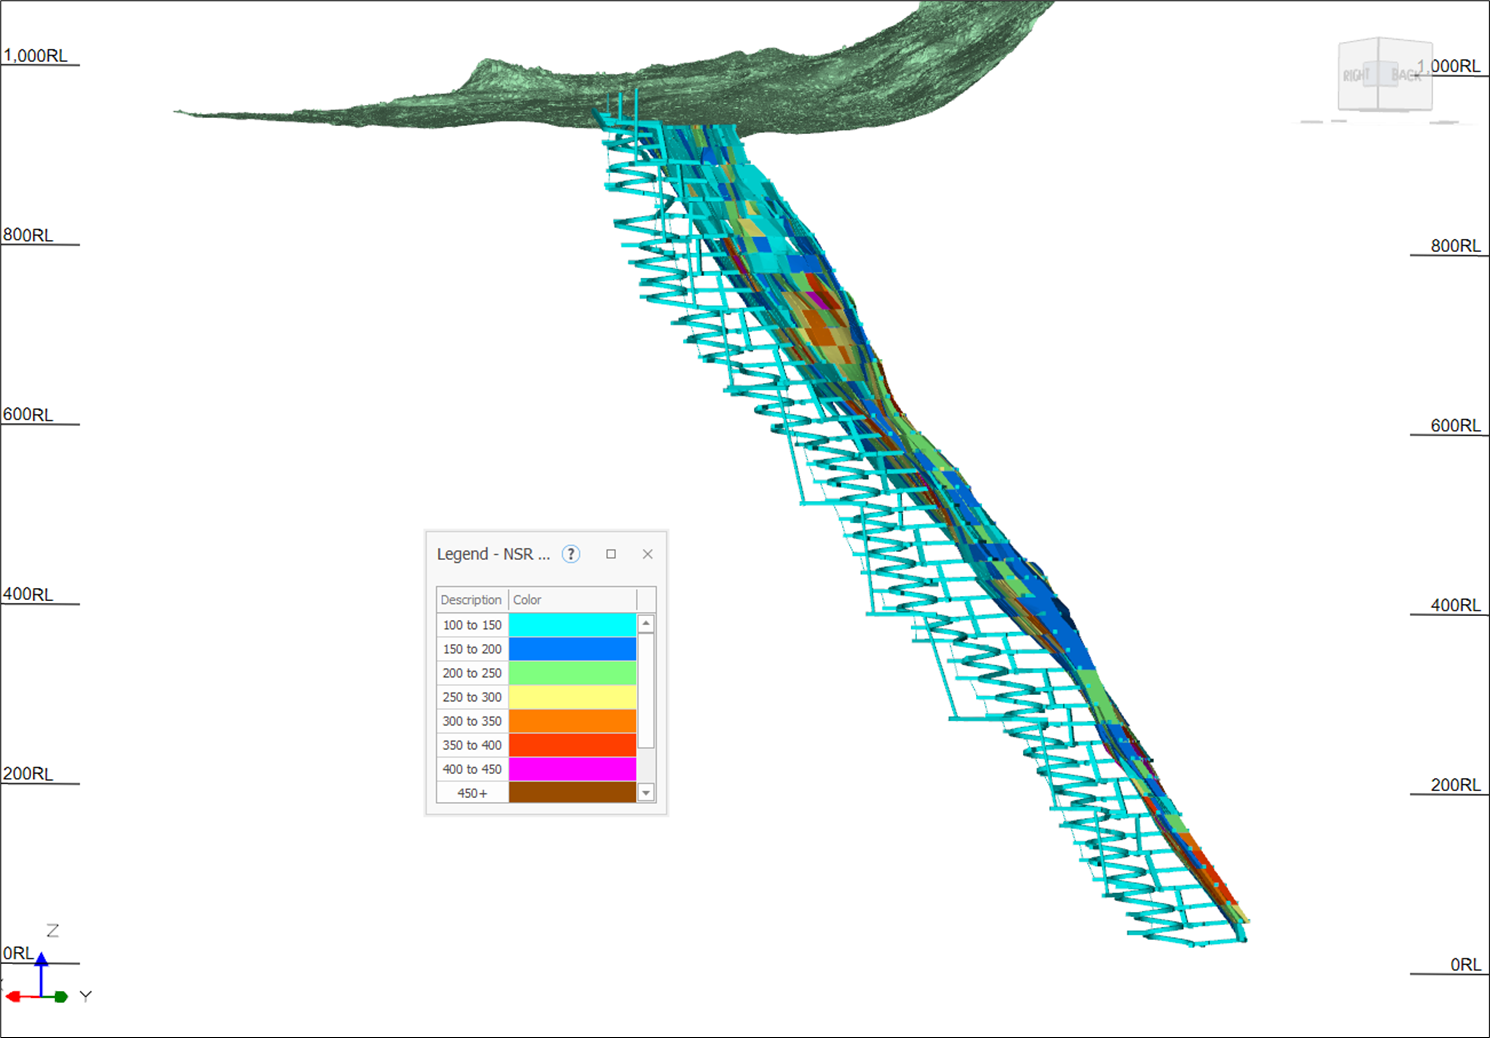
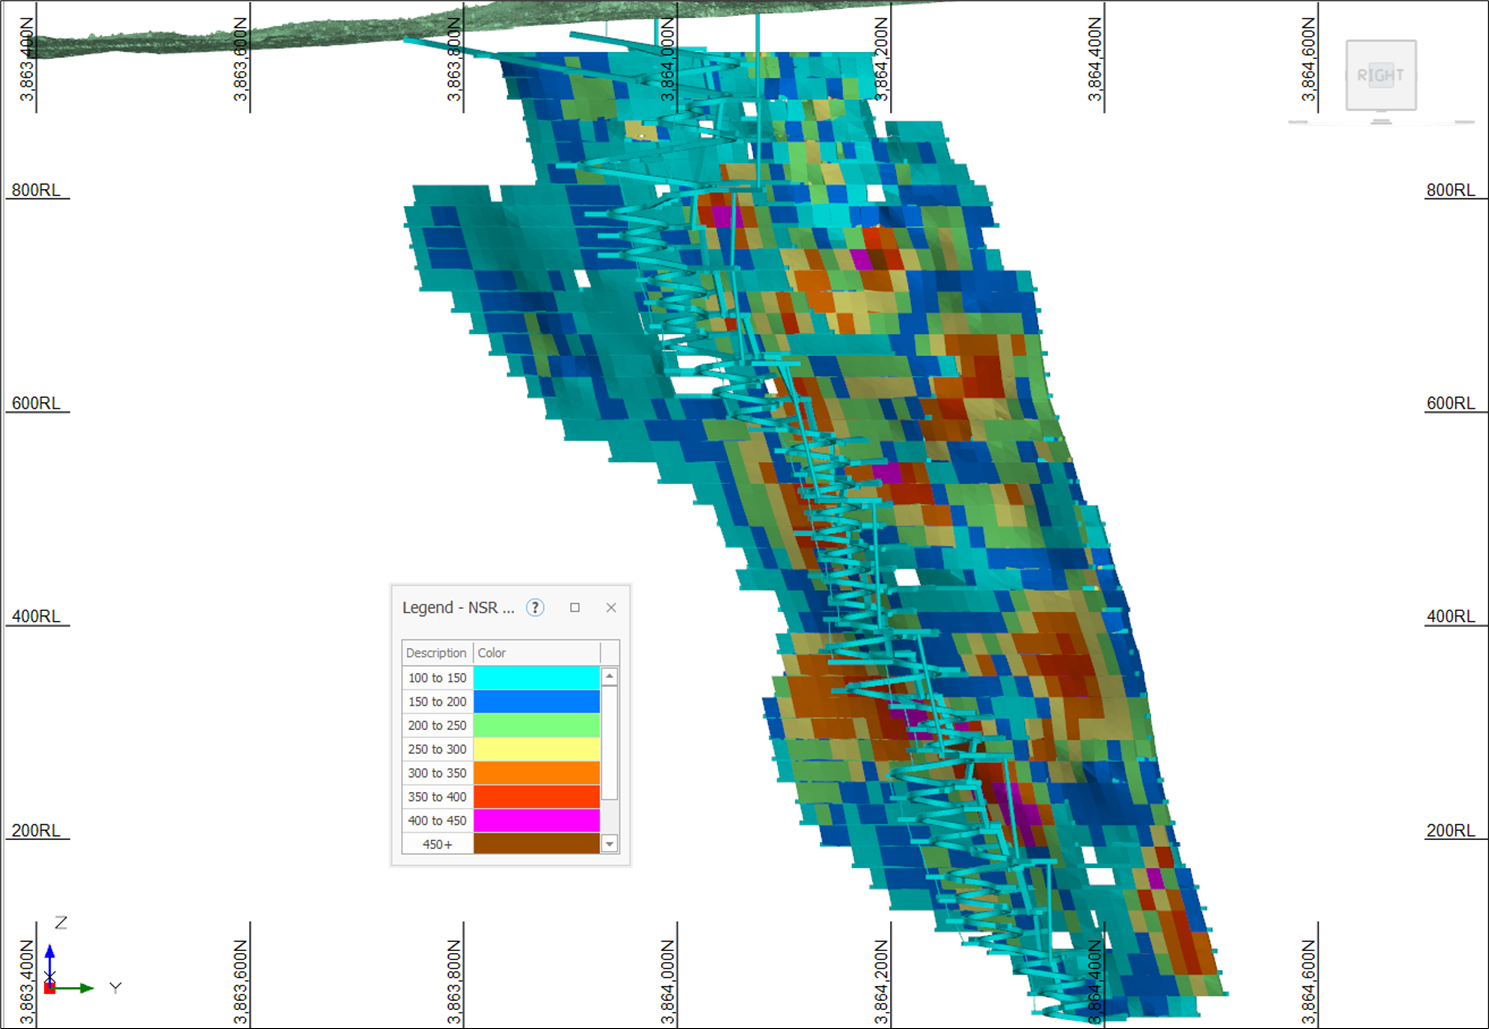
The final mine design is illustrated in Figure 3 and Figure 4, with stopes coloured by NSR value.

Life of Mine Production

Over the life of mine (“LOM”), production is forecast to total 13.6Mt at an average head grade of 1.6% Cu, 3.7% Zn, 0.6% Pb, 25g/t Ag and 0.3 g/t Au (3.0% Cu-Equiv.) .

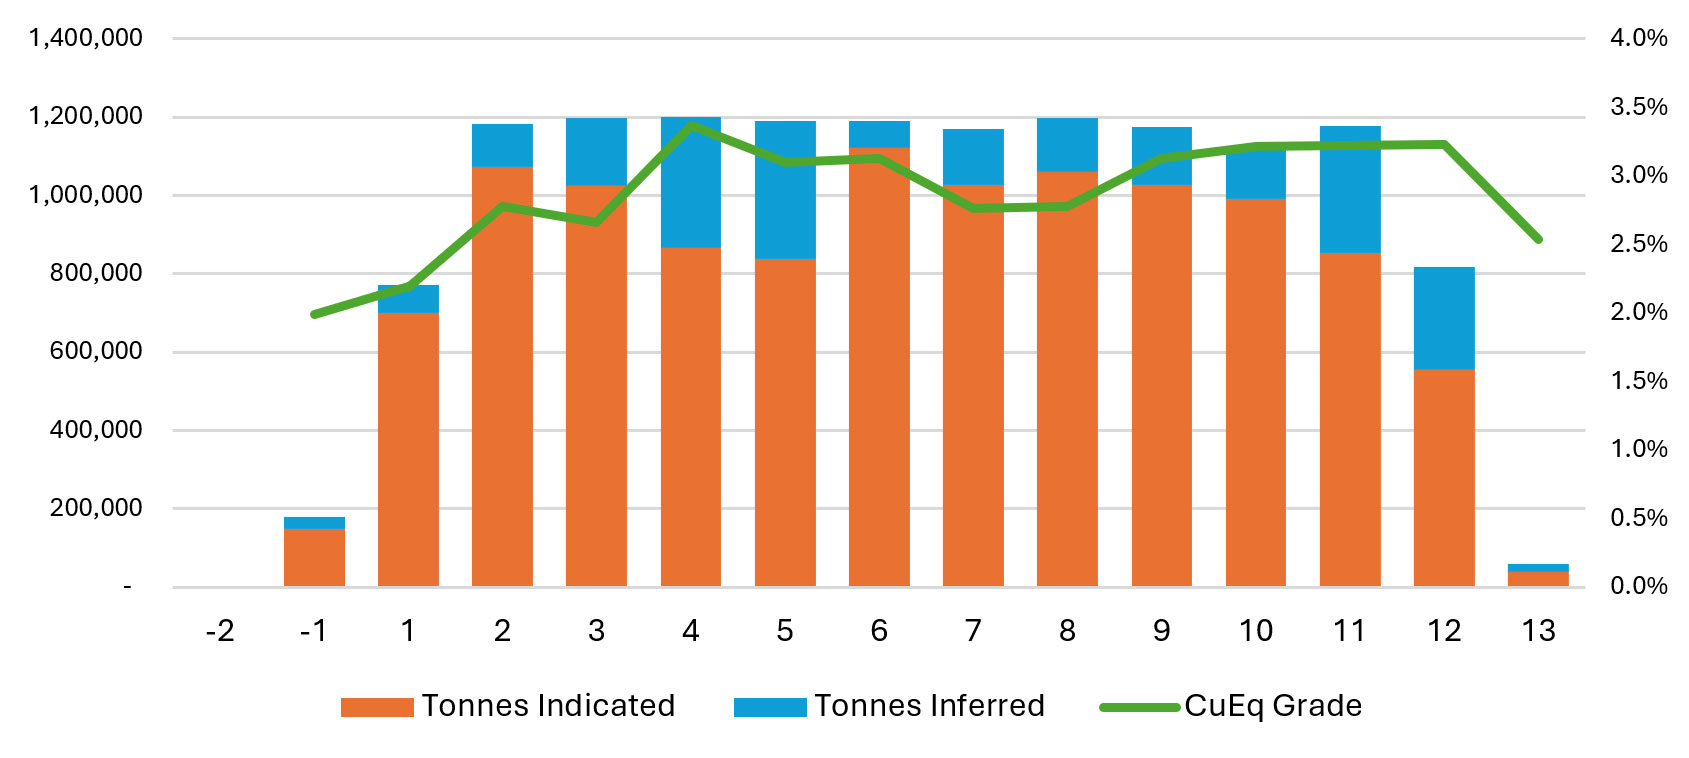
Following a 1.5-year development period, steady state production of 1.2Mtpa will be achieved in Year 2. The PFS considers an initial mine life of 12.2 years, which excludes any upside based on exploration success.

The 13.6Mt mining inventory includes both Indicated (83%) and Inferred (17%) Mineral Resources.

The breakdown of the Mineral Resource classification for the tonnes mined each year is illustrated in Figure 5.

New World notes that there is a low level of geological confidence associated with Inferred Mineral Resources and there is no certainty that further exploration work will result in the determination of Indicated Mineral Resources, or that the production target itself will be realised.

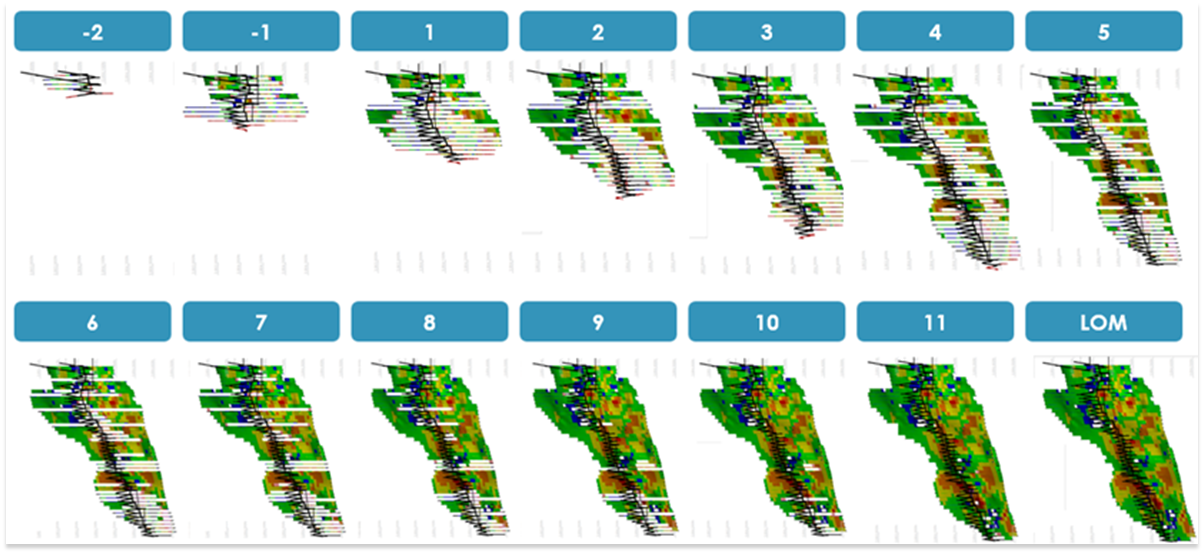
A schematic of the LOM schedule, on an annual basis, is illustrated in Figure 6.

Maiden Ore Reserve

Based on the Indicated Resources included in the mine plan, the Company has determined a maiden Probable Ore Reserve estimate for the Project that comprises:

  • 11. Mt @ 1.6% Cu, 3.7% Zn, 0.6% Pb, 26 g/t Ag and 0.3 g/t Au

Figure 3. Cross section of Mine Design (Looking Southwest)

Figure 4. Long Section of Mine Design (Looking West)

Figure 5. Annual Production by Resource Category

Figure 6. LOM Schedule

Metallurgy and Processing

Metallurgy

Since acquiring the Project in 2020, New World has commissioned extensive metallurgical testwork to support the application of traditional flotation. Five different composite samples have been collected from across the Antler Deposit for this work.

Ultimately locked cycle flotation testing was conducted on a sample that was blended to be representative of both the distribution and grade of mineralisation across the deposit over the life of mine.

Conventional flotation processing will be used to recover and sell three metal concentrates:

  • A copper concentrate
  • A zinc concentrate; and
  • A lead-silver concentrate.

Recovery and concentrate quality parameters are summarised in Table 1.

Table 1. Expected Metallurgical Recoveries and Concentrate Specifications

Product Weight Assay - % or g/t Recovery - %
% Cu Pb Zn Fe S Ag Au Cu Pb Zn Fe S Ag Au
Cu Concentrate 5.1 27.4 0.5 2.2 27.0 31.4 104 1.52 89.0 4.3 3.0 10.9 14.3 25.2 59.5
Pb-Ag Concentrate 0.5 3.92 55.3 6.3 9.1 20.8 1,361 1.37 1.3 49.3 0.8 0.4 0.9 32.9 5.3
Zn Concentrate 6.6 0.99 2.3 52.3 7.8 33.8 76 0.24 4.1 26.3 90.9 4.0 19.7 23.8 12.2

Metallurgical Flowsheet

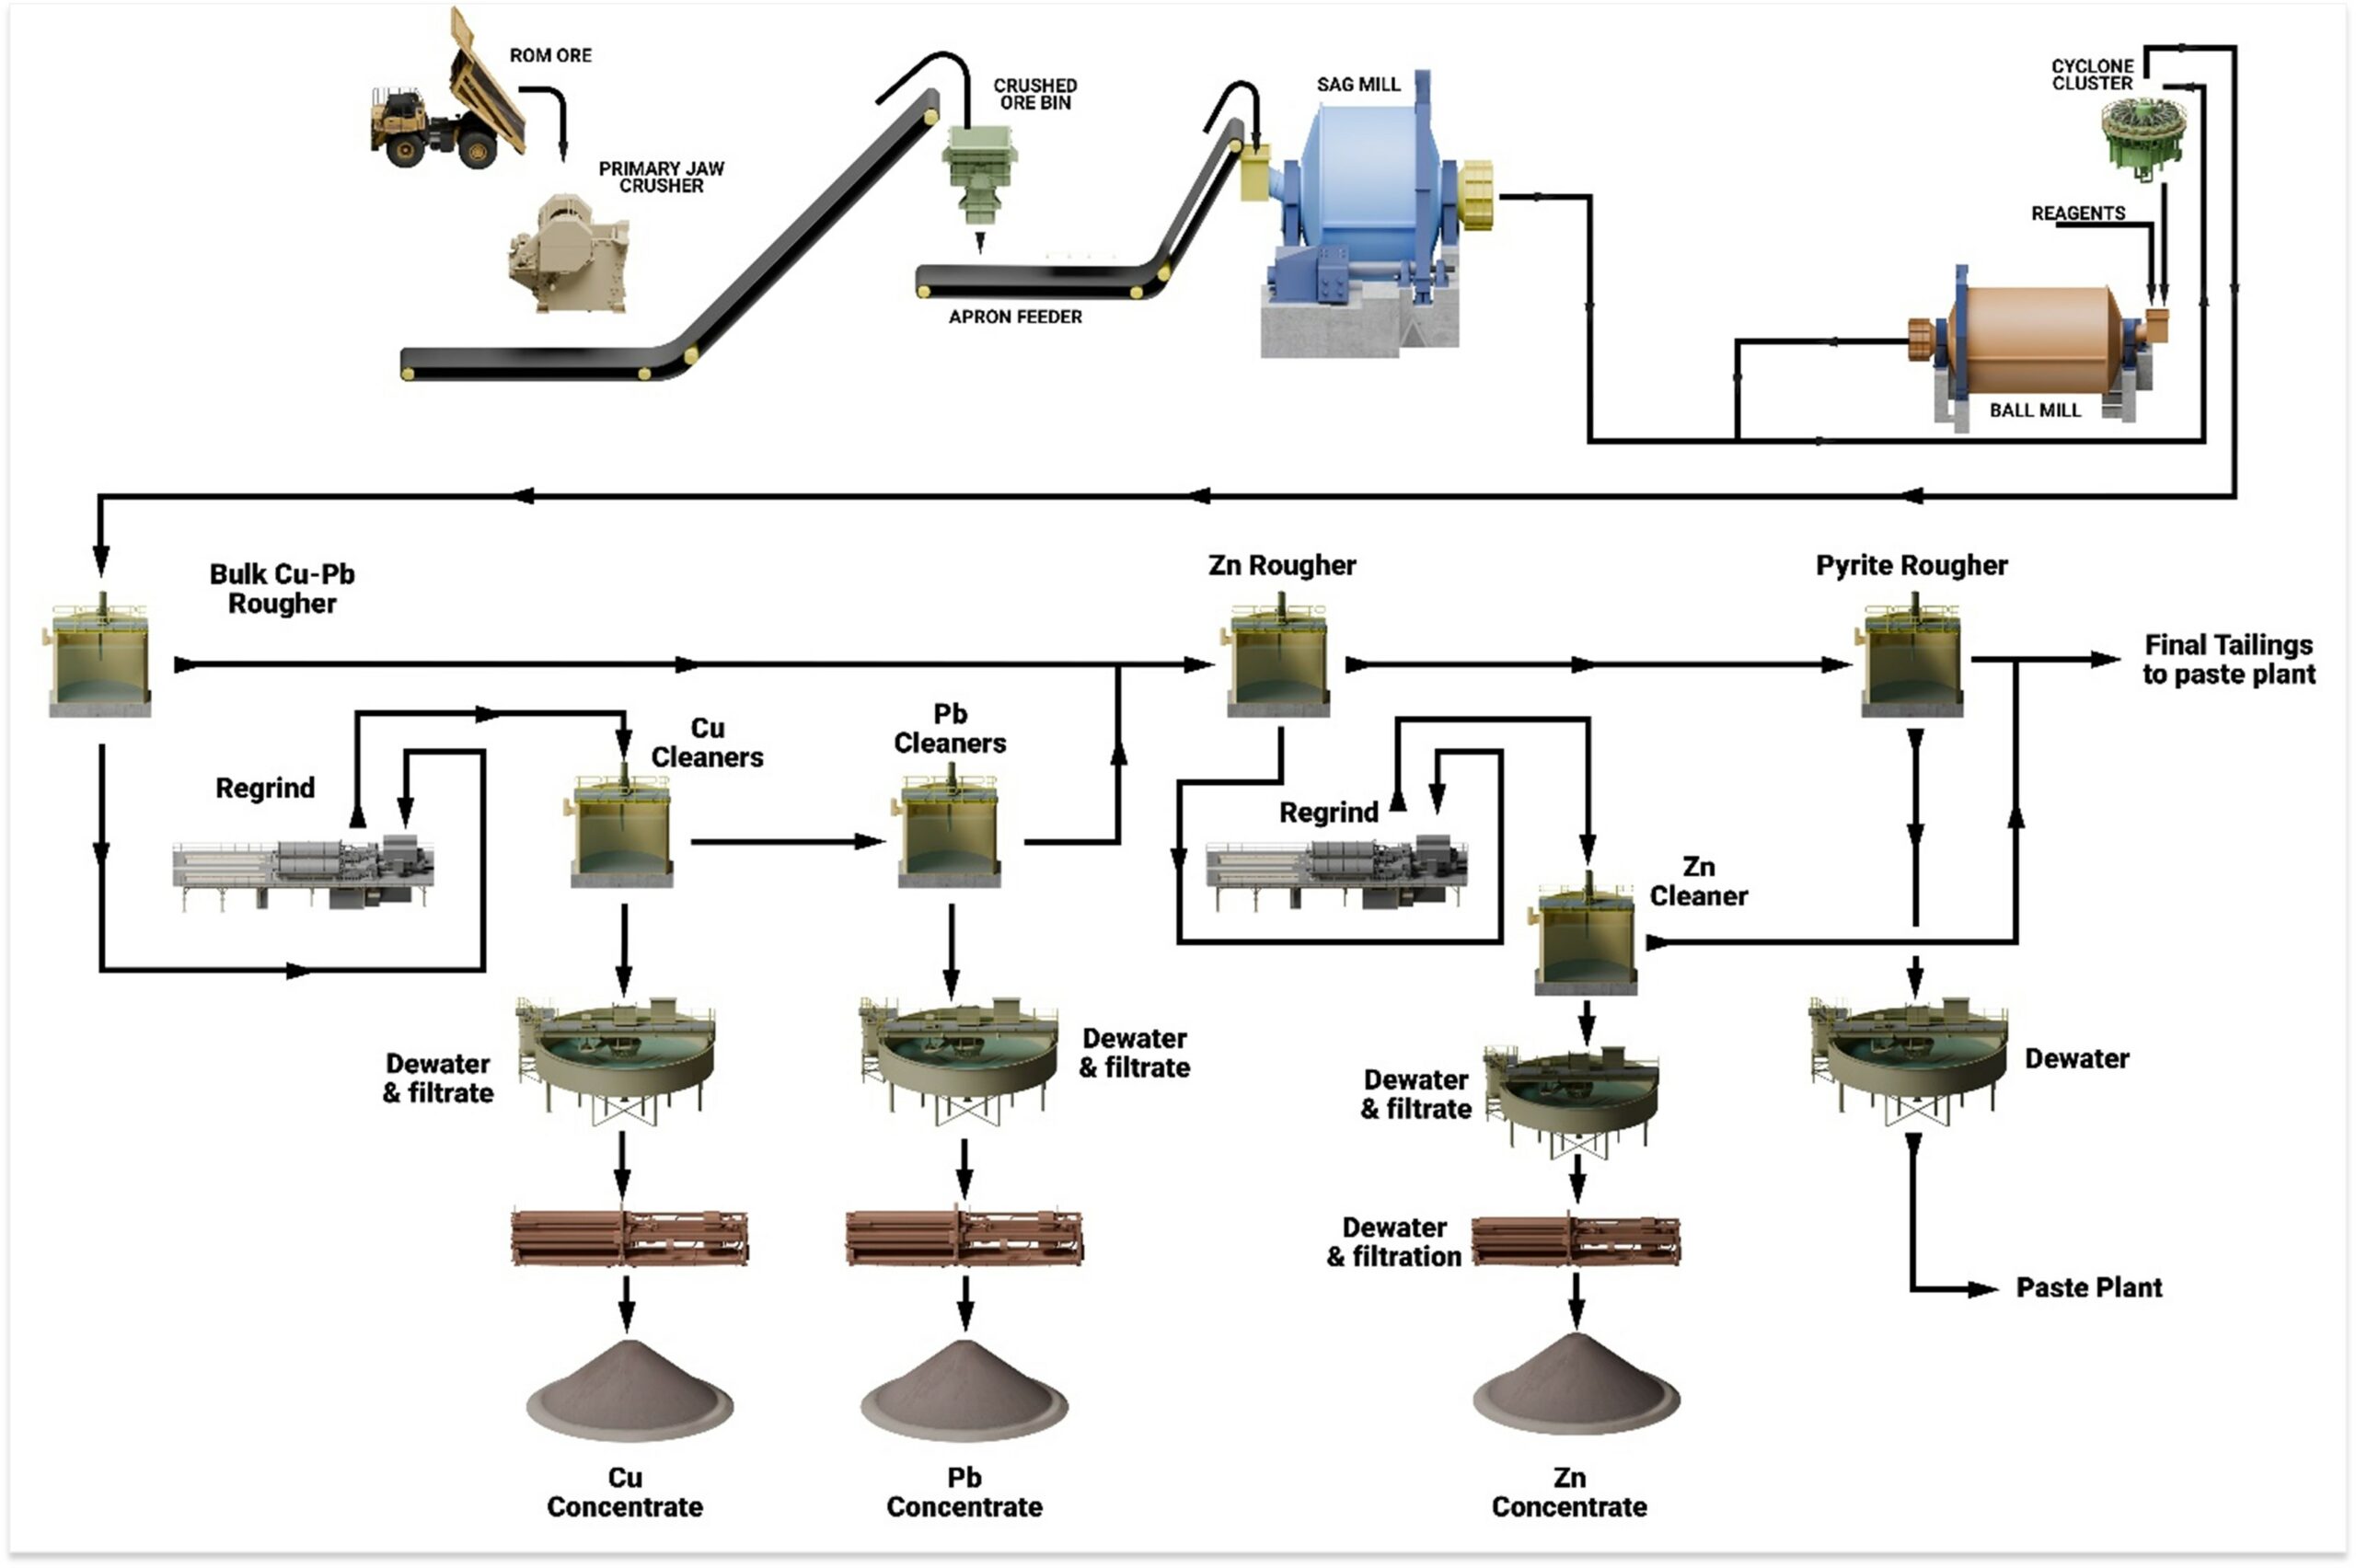
A conventional process flow sheet will be employed, as illustrated in Figure 7. The major components comprise:

  • Jaw crushing;
  • SAG mill and ball mill grinding;
  • Rougher flotation of bulk copper and lead;
  • Regrinding of the bulk (Cu-Pb) concentrate;
  • Copper cleaning/separation; and
  • Lead cleaning.
  • Zinc flotation;
  • Zinc concentrate regrinding and cleaning;
  • Pyrite/pyrrhotite flotation for selective disposal;
  • Thickening and filtration of separate copper, zinc and lead concentrates; and,
  • Tailings thickening and filtration.

Concentrates will be loaded into either sea containers or rotainers at the processing plant for transport to a port or smelter(s).

Figure 7. Simplified Process Flow Sheet

Project Infrastructure

Dry-stack Tailings Storage Facility

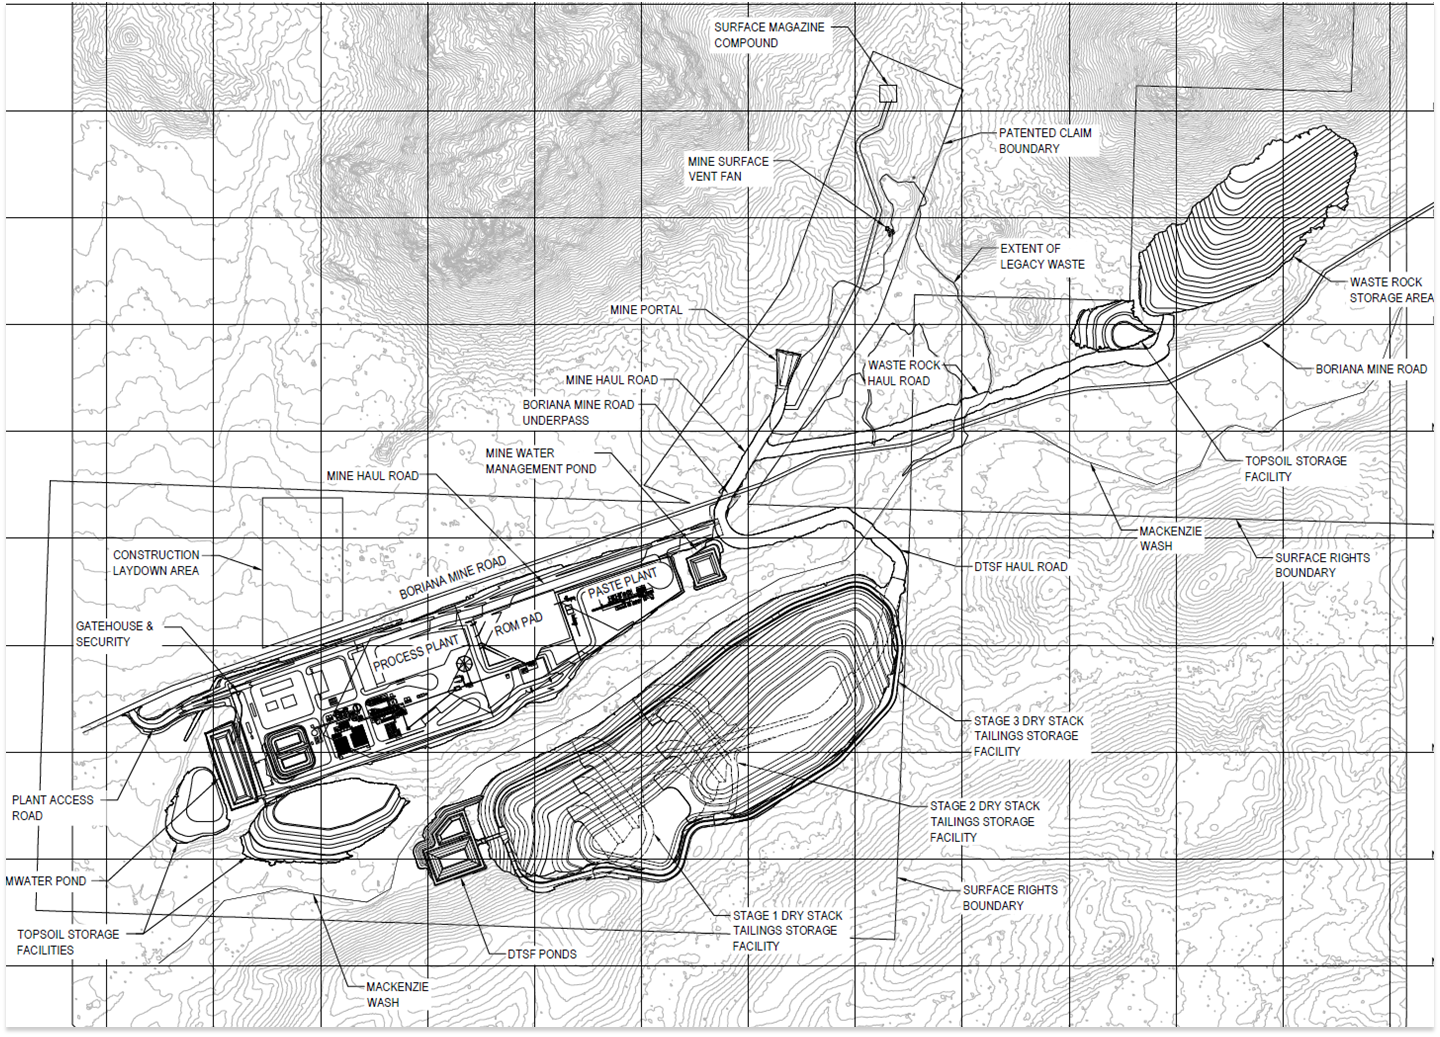
In line with industry best practice, a fully-lined dewatered (“dry-stack”) tailings storage (“DTSF”) facility will be constructed adjacent to the processing plant to provide secure, long-term confinement of tailings. The DTSF has been designed to the highest of regulatory standards.

Water

Water will be sourced from a well field located on private land the Company owns approximately 12km west of the Antler Deposit. Water will be pumped from a well(s) to the processing plant site via a 15.6km pipeline.

Power

A fully operational overhead mains power distribution line currently extends to the planned location of the processing plant. The Company is currently undertaking a detailed study into upgrading this power line to 69kV.

The overall Project layout is illustrated in Figure 8.

Figure 8. Project layout

Production Projection

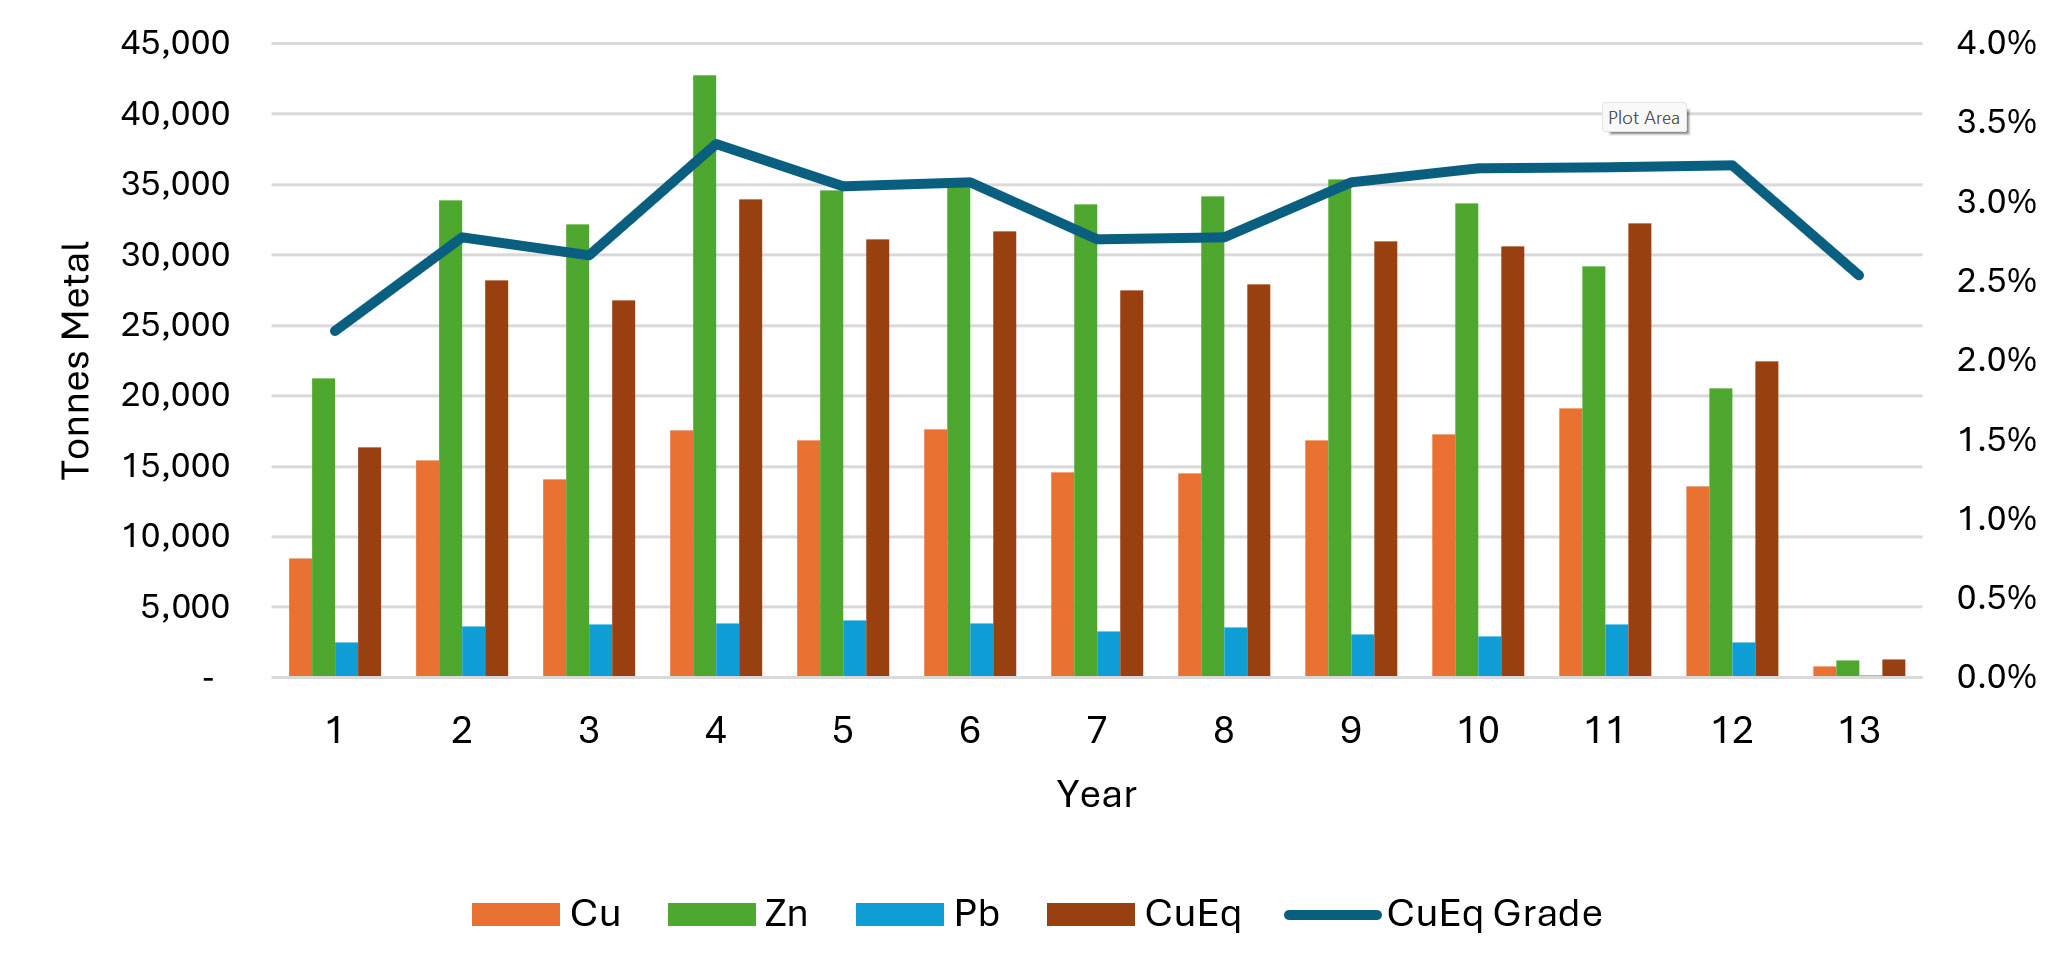
Over the life of mine, 186,700 tonnes of copper, 387,600 tonnes of zinc and 41,100 tonnes of lead, 6.0Moz of silver and 67.5koz of gold will be payable in three separate concentrates. This equates to 341,000 tonnes on a copper-equivalent basis (Table 2).

Once steady state-production is achieved (processing 1.2Mt per annum; years 2-11), average annual payable production will comprise 16,400 tonnes of copper, 34,500 tonnes of zinc, 3,600 tonnes of lead, 533,300 ounces of silver and 6,000 ounces of gold, or 30,100 tonnes on a copper-equivalent basis (see Figure 9).

Table 2. Payable Metal Production (LOM and Annual Average)

Metal Production LOM
Payable Metal
Annual Average Production (Years 2-11)
Payable Metal
Copper 186,700 tonnes 16,400 tonnes
Zinc 387,600 tonnes 34,500 tonnes
Lead 41,100 tonnes 3,600 tonnes
Silver 5,960,000 oz 533,300 oz
Gold 67,500 oz 6,000 oz
CuEq 341,100 tonnes 30,100 tonnes

Figure 9. Payable Base Metal and CuEq Metal by Year

Capital Costs

Pre-Production Capital Costs

The pre-production capital cost to develop the Project is estimated to total US$297.6 million. This includes US$31.4M for contingencies. A breakdown of this estimate is provided in Table 3.

Table 3. Pre-Production Capital Cost Estimate

Capital Item US$M
Mining and Mine Infrastructure $49.6
Processing Plant $100.5
Bulk Earthworks $6.6
HV Power Switchyard and Power Distribution $1.2
Surface Civils (WRSF, DTSF and Buildings) $16.4
Water Supply $5.3
Power Supply $11.0
Commissioning & Spares $7.0
Engineering Services $22.5
Paste Plant $29.6
Contingency $31.4
Preproduction Operating Costs $16.5
TOTAL $297.6

Operating Costs

Total C1 operating costs are projected to average US$77.43 per tonne of ore milled, as set out in Table 4.

Because of the considerable revenue generated from the sale of metal products other than copper, the C1 cost for copper production is forecast to be US$0.12/lb, with an AISC of US$0.51/lb. This equates to a C1 operating cost of US$1.97/lb, and an AISC of US$2.18/lb for copper-equivalent metal in concentrate.

*C1 Cash costs include mining costs, processing costs, mine-level G&A, transport, treatment and refining charges and royalties
**AISC include cash costs plus sustaining capital and closure costs

Table 4. Operating Cost Estimates

Operating Costs   Units  LOM Total / Avg. 
Mining Cost   US$/t milled  48.9
Processing Cost  US$/t milled  23.89
G&A Cost  US$/t milled  4.65
Total Operating Costs  US$/t milled  77.43
TC/RC's, Freight, Insurance, Royalty US$/t milled  31.03
Sustaining Capital  US$/t milled  11.7
AISC**  US$/t milled  120.16
C1 Cash Costs*  US$/lb CuEq  1.97
AISC**  US$/lb CuEq 2.18
C1 Cu Cash Cost Net of By-Products US$/lb Cu 0.12

Economic Analysis

Long-term metal price forecasts have been used to model the economic potential of the Project (see Table 4). With 13.6Mt delivered to the mill for processing, gross revenue over the LOM would be US$3.16 billion (A$4.61 billion).

With total operating costs of US$1.48 billion and total capital expenditure over the LOM of US$457.1 million (including pre-production and sustaining capital and closure costs), net free cash flow is projected to be US$1.22 billion (A$1.8 billion; undiscounted; pre-tax). Tax payable is estimated to total US$244m, so post-tax net cash flow will be US$978 million (A$1.4 billion).

The pre-tax NPV7 of the Project is US$636m (A$929m); and post-tax NPV7 is US$498M (A$726m). The pre- and post-tax internal rates of return are 34.3% and 30.3% respectively.

The post-tax payback period is forecast to be 3.3 years from commencement of production.

During steady-state production (Years 2-11), annual post tax free cash flow averages US$115m (A$168m) per year.

A summary of key economic metrics is included in Table 5 and Table 6.

55% of revenue will be generated from sales of copper, 33% from zinc, with lead, silver and gold contributing 3%, 5% and 4% of total revenue.

Table 5. Commodity Price Assumptions

Commodity Price (Imperial) Price (Metric)
Copper US$4.20/lb US$9,259/t
Zinc US$1.23/lb US$2,712/t
Lead US$1.00/lb US$2,205/t
Silver US$25.00/oz US$25.00/oz
Gold US$2,055/oz US$2,055/oz

Table 6. Key Economic Metrics for the Life of Mine

Metric  Units   US$ A$
Revenue   $M  3,158 4,611
EBITDA   $M  1,679 2,452
Pre-Production and Sustaining Capital and Closure Costs $M 457 667
Pre-Tax Unlevered Free Cash Flow   $M  1,222 1,785
Taxes   $M  -244 -356
Post-Tax Unlevered Free Cash Flow   $M  978 1428
Pre-Tax NPV (7%)   $M  636 929
Pre-Tax IRR   %  34.3% 34.3%
Pre-Tax Payback   years  3.1 3.1
Post-Tax NPV (7%)   $M  498 726
Post-Tax IRR   %  30.3% 30.3%
Post-Tax Payback   years  3.3 3.3

Forward Plans

Further Exploration

Mineralisation at the Antler Deposit remains open at depth and along strike. Exploration is currently in progress to test for the strike extensions of mineralisation. It is widely accepted that VMS deposits typically occur in clusters. New World has delineated more than 17 high-priority exploration targets (across its Antler and Javelin Projects, which is located 75km to the southeast) where discovery could result in development of satellite deposits. Ore from these areas could be trucked to the Antler Project to extend the life of the operation and/or increase the production profile. This would potentially enhance the economics of developing the Antler Project.

Mineralisation at the Antler Copper Deposit remains completely open at depth, with results from some of the deeper holes drilled to date including:

  • 27.0m @ 7.0% Cu-equivalent;
  • 18.2m @ 3.4% Cu-equivalent;
  • 10.7m @ 13.7% Cu-equivalent; and
  • 21.3m @ 5.3% Cu-equivalent.

In line with the positive results from the PFS, the Company will immediately advance the Antler Project through a DFS, to continue to de-risk the the technical and financial aspects of developing the Project. DFS work will include:

  • At depth at the Antler Deposit itself;
  • Along strike from the Antler Deposit, particularly to the south;
  • Over >6km of strike to the NE of the Antler Deposit, in the Roadrunner Project area, where multiple coincident soil geochemistry and induced polarisation (IP) geophysical anomalies have been delineated recently in highly prospective geological sequences; and
  • At regional projects where additional mineralisation may be within trucking distance of the Antler Project.

Definitive Feasibility Study

In line with the positive results from the PFS, the Company will immediately advance the Antler Project through a DFS, to continue to de-risk the the technical and financial aspects of developing the Project. DFS work will include:

  • Detailed Project definition
  • Reserve definition drilling
  • Further work to optimise the mine plan and mine scheduling
  • Advanced metallurgical testwork
  • Engineering and financial assessment to allow for investment decision
  • Align design for mining, tailings, environmental and community controls and review any optimisation options
  • Process plant and infrastructure engineering and site layout definition
  • Development of Project Execution Plan with supporting documents
  • Integration of future plant expansion concepts into final design
  • Further exploring offtake and concentrate marketing
  • Investigate the potential for selling the sulphide concentrate (from the pyrite float)

Mine Permitting

In January 2024, the Company submitted a Mine Plan of Operations (“MPO”) to the BLM, which is the first stage of formally obtaining approval to construct the proposed mining infrastructure on public lands. The MPO is expected to have the longest approval lead-time of all of the requisite permits.

Commencing in Q3 2024, the Company intends progressively submitting applications for requisite State mine permits.